How I created a map for my Micro.blog site
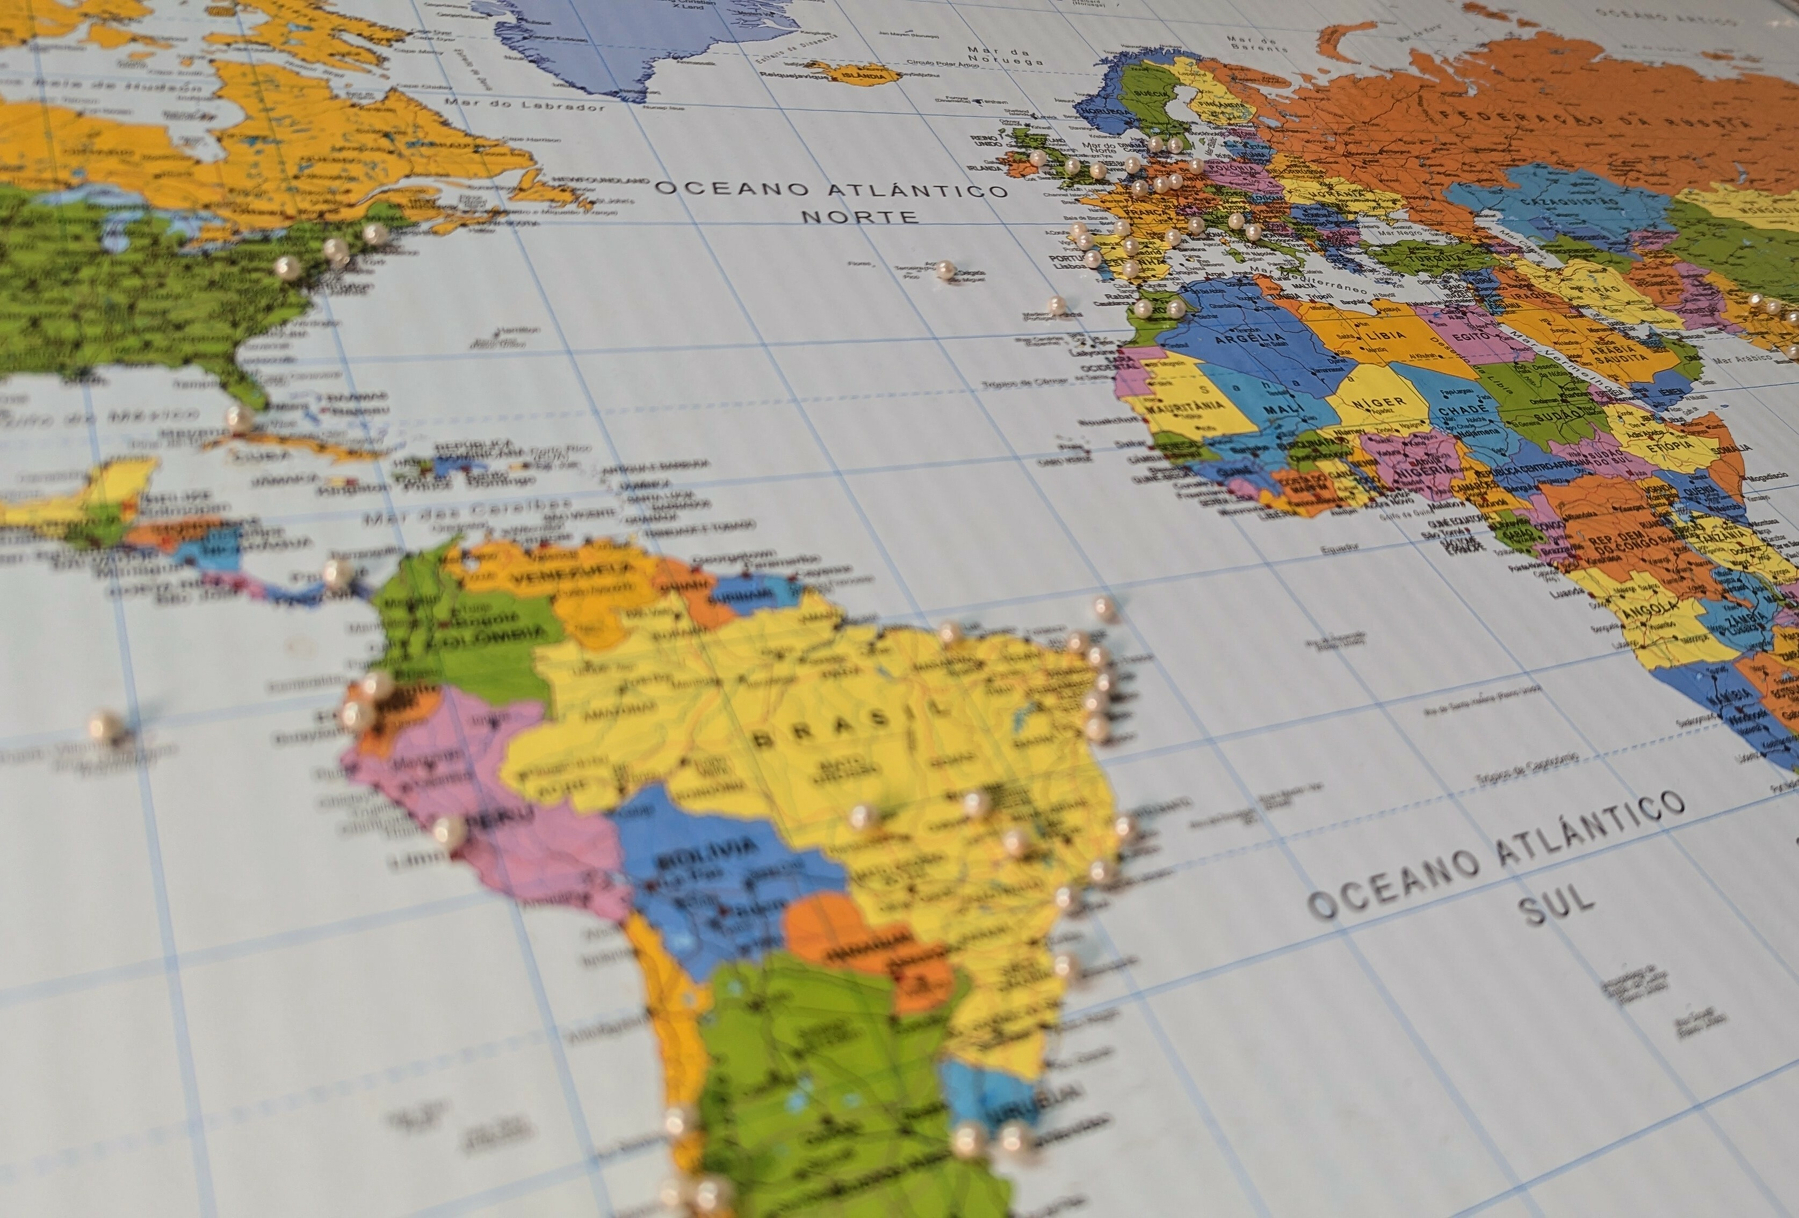
I’ve always loved maps, and the idea of creating a digital version of the pins from the physical world map on my wall has been with me for a long, long time. When I first saw websites with embedded Google Maps, I knew I wanted to do something similar on my blog.
How it works
Every post related to a trip or a specific place on my blog has at least three tags: city, country, and earth. For example, porto, portugal, and pale-blue-dot. If you don’t know what “Pale Blue Dot” refers to, do yourself a favor and watch the beautiful video on this page. So, the site map is built by checking a list of city coordinates linked to those categories.
In Obsidian, however, my location property contains the precise coordinates where a note was taken and creates the super detailed map below that I absolutely love. But the tags, which Micro.publish converts to categories in my blog, are also there.
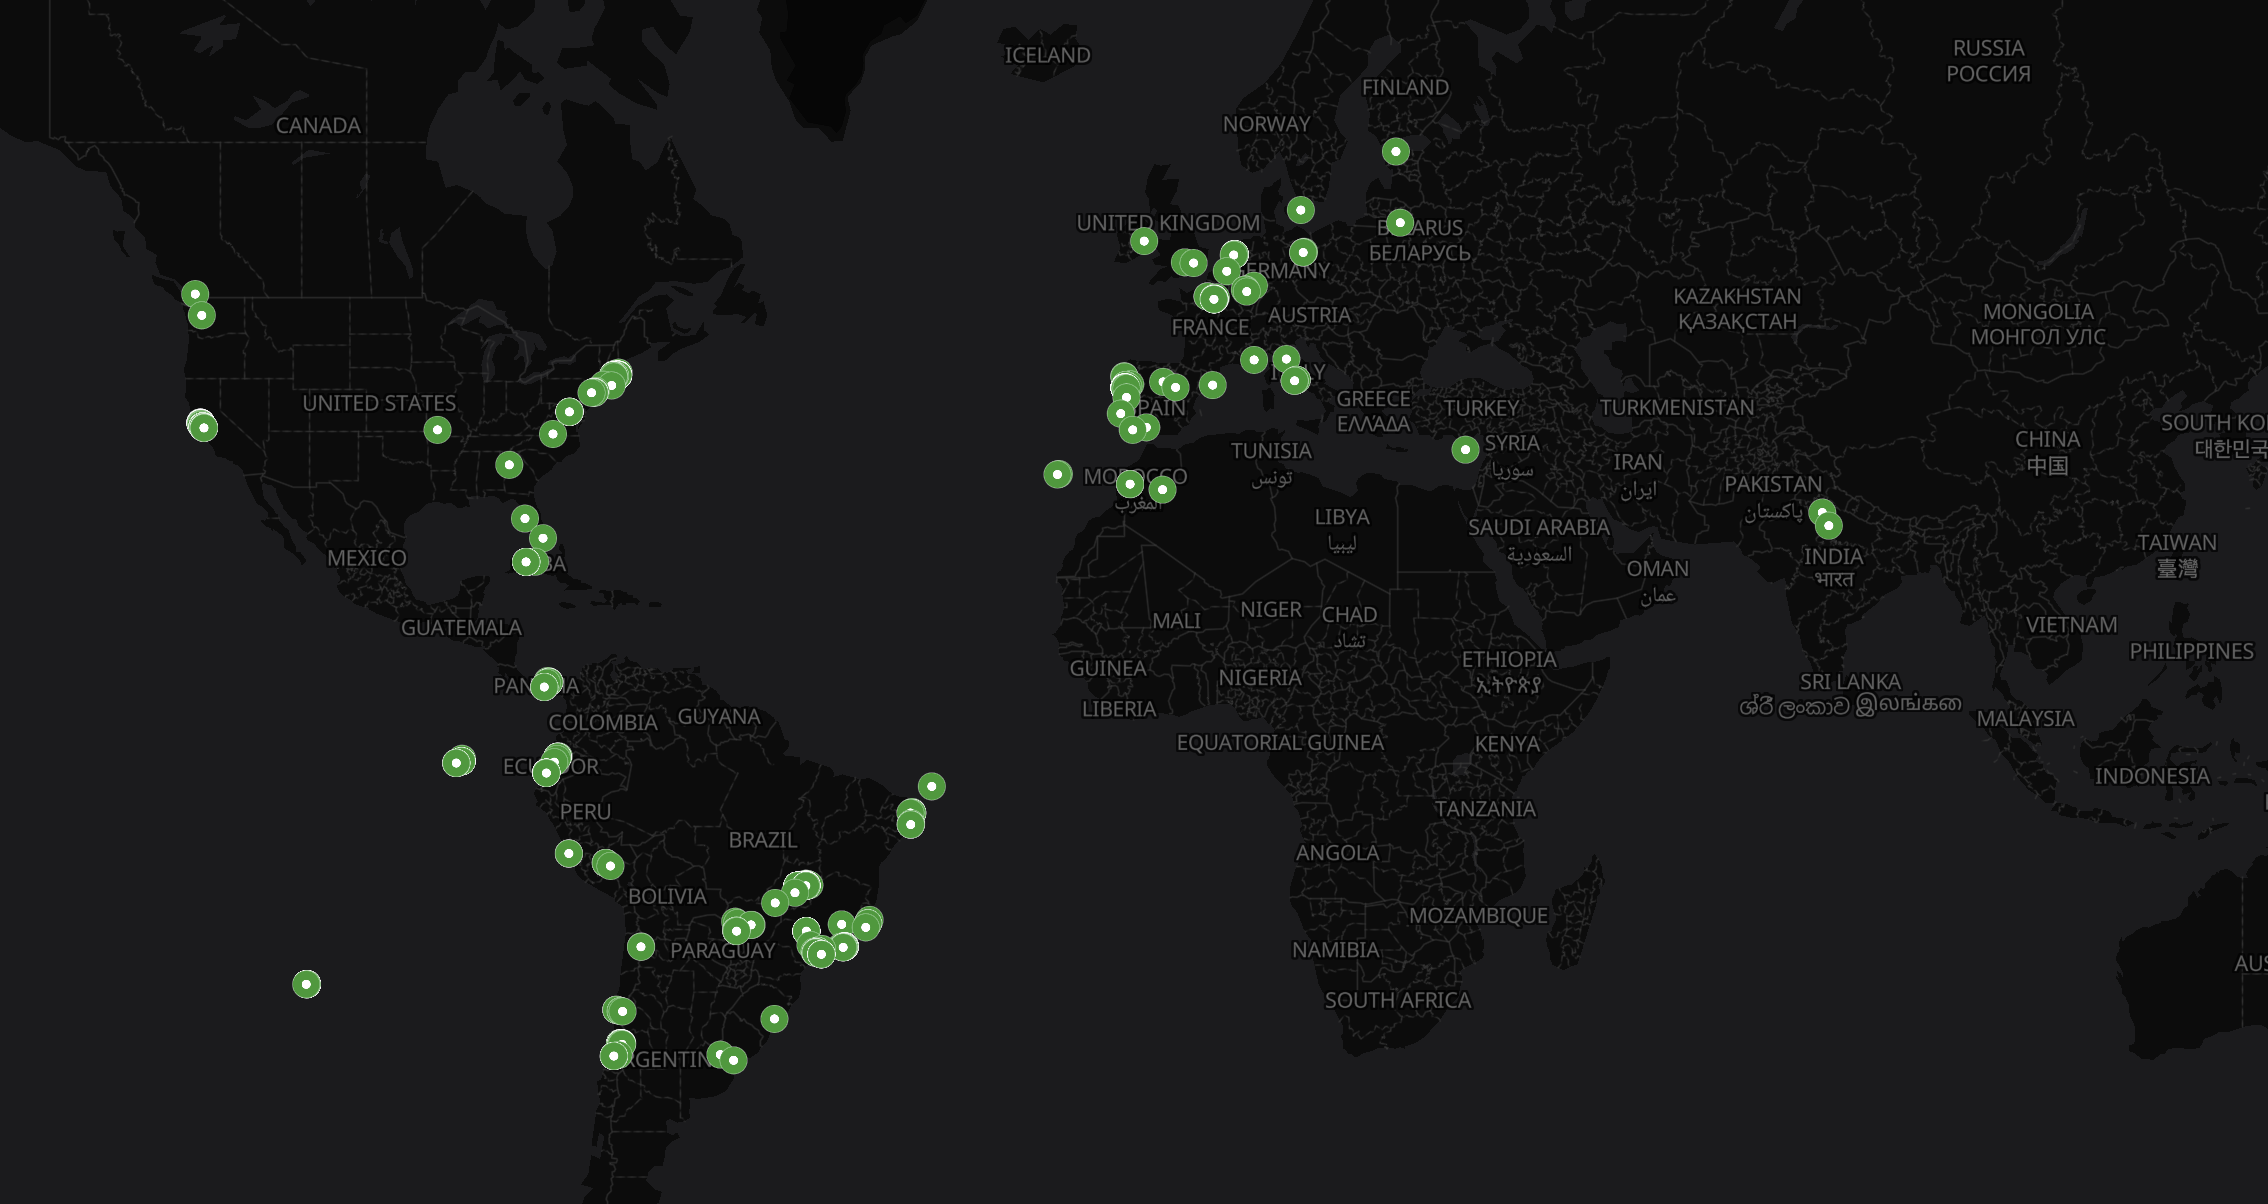
For privacy reasons, I’ve chosen to make the public map on my site less detailed, which is why I opted for general city coordinates instead. Here is an example of the data structure I use for the public version:
- name: "Boston, USA"
  slug: "boston"
  lat: 42.3601
  lon: -71.0589
  url: "/categories/boston"

- name: "Porto, Portugal"
  slug: "porto"
  lat: 41.1579
  lon: -8.6291
  url: "/categories/porto"
To render the map, I simply add the small snippet of code below to any page. You can see the live example here.
<div id="categoryMap" style="width: 100%; height: 400px; border-radius: 12px;"></div>
Creating a map for your Micro.blog site
This isn’t a plugin, so it isn’t a “plug-and-play” solution, but it is relatively straightforward to set up. I’ll soon publish a video demonstrating the steps, but if you are a Micro.blog user, you can already follow the instructions and use the code in this GitHub repository.
How I built it
I’m not a developer, but I learned enough HTML to build my first site back in the 90s, and from there I actually tried learning some other languages. Although that wasn’t for me, and I never fully dedicated myself to programming, that “almost-skill” became incredibly useful. Understanding the logic of how programs work eventually led me to managing projects and leading developer teams.
For this map, I used AI as my developer team. I didn’t simply ask it to “build a map”; I instructed it on exactly how I wanted things to work. For example, I knew I needed a table associating coordinates with categories. Initially, Gemini created a .json file. As a proof of concept, that worked. However, I knew it wouldn’t be practical long-term, as it meant uploading a new file every time I added a city.
When I made sure everything was working, I asked the AI to rewrite the code to read the list from a data file instead.
I approached this project and others similar to it as if I were the one writing the code. I start with the architectural concept and ask the AI to execute the syntax. From that first version, I keep asking it to make changes here and there. And to learn from the process, I always review the code and ask Gemini to explain specific lines. Finally, when I can’t find something in the code, I ask it to tell me where that routine is. I’ll clearly never become a full developer this way, but it certainly makes me better at building these projects.
What’s next?
I’m happy with the result: it’s simple, private, and easy to update. But I also see it as a starting point and a proof of concept. A plugin would be much more practical for general use, and I can already imagine new features—like a field for adding coordinates to a specific post to generate a unique map just for that entry.
If you are a developer and see the potential, go have some fun with it!
Final note
I have a lot of respect for the work developers do, and I find it fascinating that the mysterious codes they write created so many incredible things that make our world run—pun intended 😉. I’m not one of those brilliant minds, but I’m incredibly happy to see something I envisioned published on GitHub. It’s truly an honor.